NST Screen Shots
The following screen shots will give you an idea of some of the
capabilities of NST.
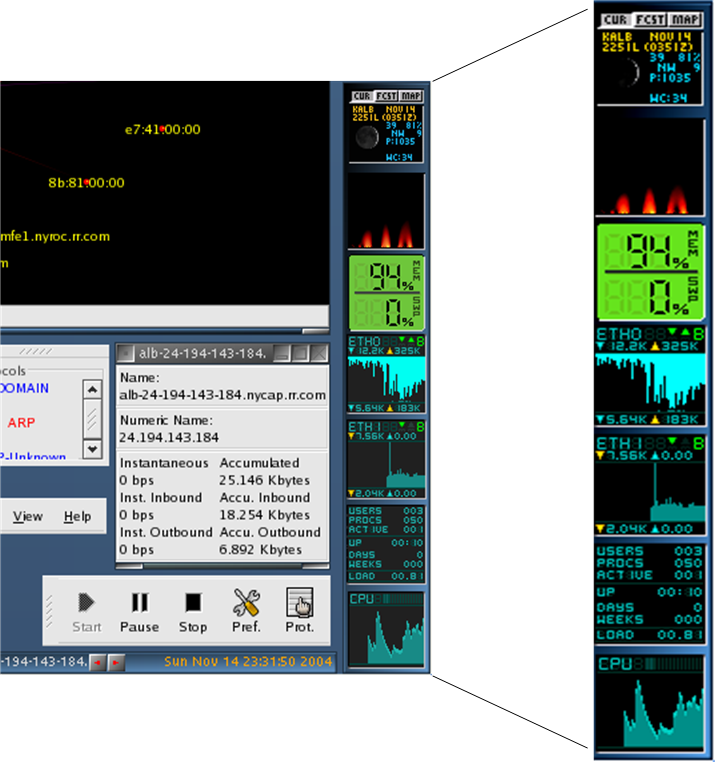
NST Network Interface Bandwidth Monitor
nsttracroute: Albany, New York To www.vaisala.com
ntop World Map Hosts
The Mercator World Map shown above displays all "
Hosts" geolocated from an
ntop session.
See the HowTo document:
HowTo Geolocate ntop Data
for more information.
Network Protocol Analyzer: Web Interface To Wireshark
The
NST WUI provides a full front end to the
wireshark network protocol analyzer. This screen shot
demonstrates one of the available decoded outputs (TCP traffic) as it
will appear in the
1.5.0 release of
NST. In addition
to the color coding, hot links are provided which enable one to
further
drill down to packets which interest them
(including the ability to dynamically follow a particular TCP
stream).
Network Protocol Analyzer: Wireshark with I/O Graph
This screen shows an I/O graph produced by the
network protocol analyzer:
wireshark (
Note: Formerly
know as: ethereal). The red bars
on the graph represent
http protocol network traffic. The NST
FluxBox desktop in this screen was rendered with a
VNC client running on a Windows XP Professional desktop.
NST Virtual Machine
This screen shot
shows what one will typically see after logging into the
NST Virtual Machine. The sceen shot was taken
on a Windows XP desktop running at 1280x1024 using the
GIMP. The NST
Virtual Machine (version 1.4.1) is shown running at 1024x768 within
a
VMware Server Console. The NST is running within a
VMware Server (the free version) on this same Windows XP
system. If you look closely, you'll notice:
- The password needs to be set.
- The IP address (192.168.0.59) of the virtual NST system
is shown on the title line (NST WUI Home Page) of the page
loaded in firefox.
- This is a dual core system (gkrellm is showing information
for both CPU0 and CPU1).
- This VMware Server is also running a virtual Fedora Core 4 system
for doing NST development (see the "FC4 for NST
Development" tab in the VMware Server Console).
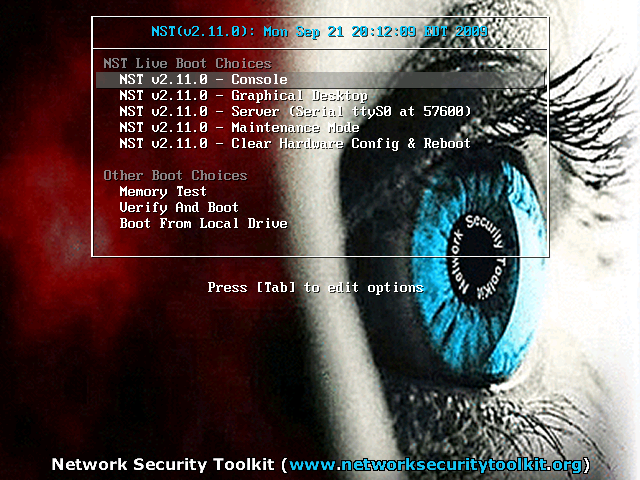
NST Live Boot Screen
This is a typical display of the main NST Live boot screen.
NST Grub2 Boot Screen
This is a typical display of an NST
GRUB2 boot screen.
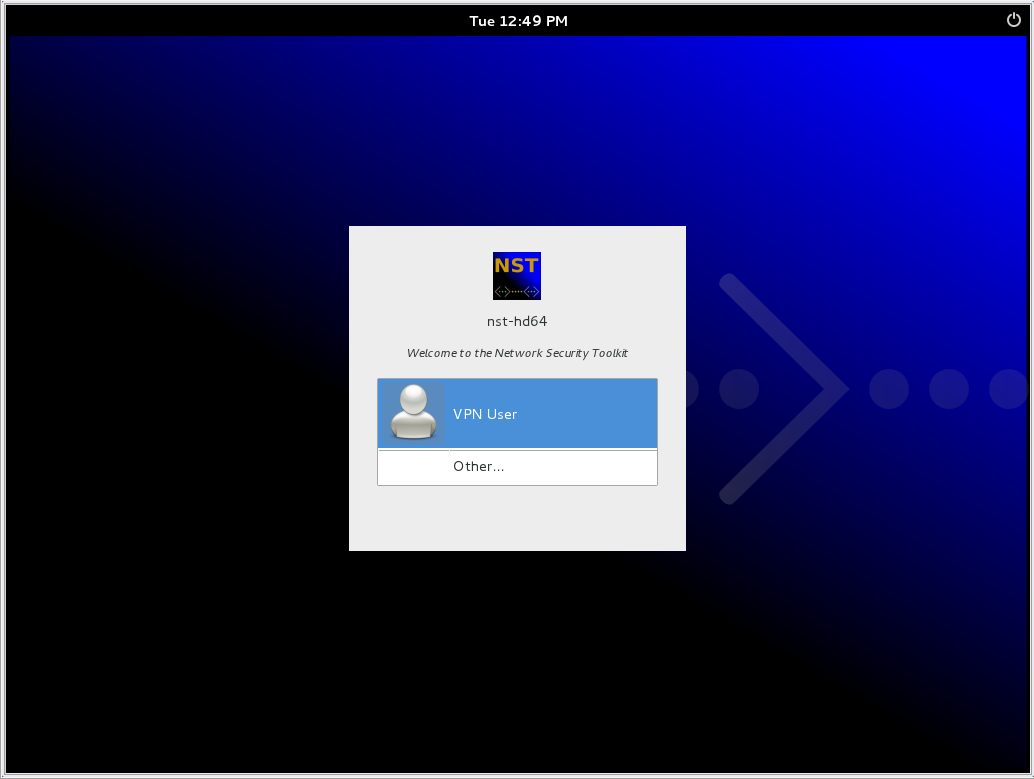
NST Login Screen (GNOME 3 GNOME Shell)
NST Login Screen (GNOME 3 Fallback Mode GDM)
NST (GNOME 3 Desktop - W3af)
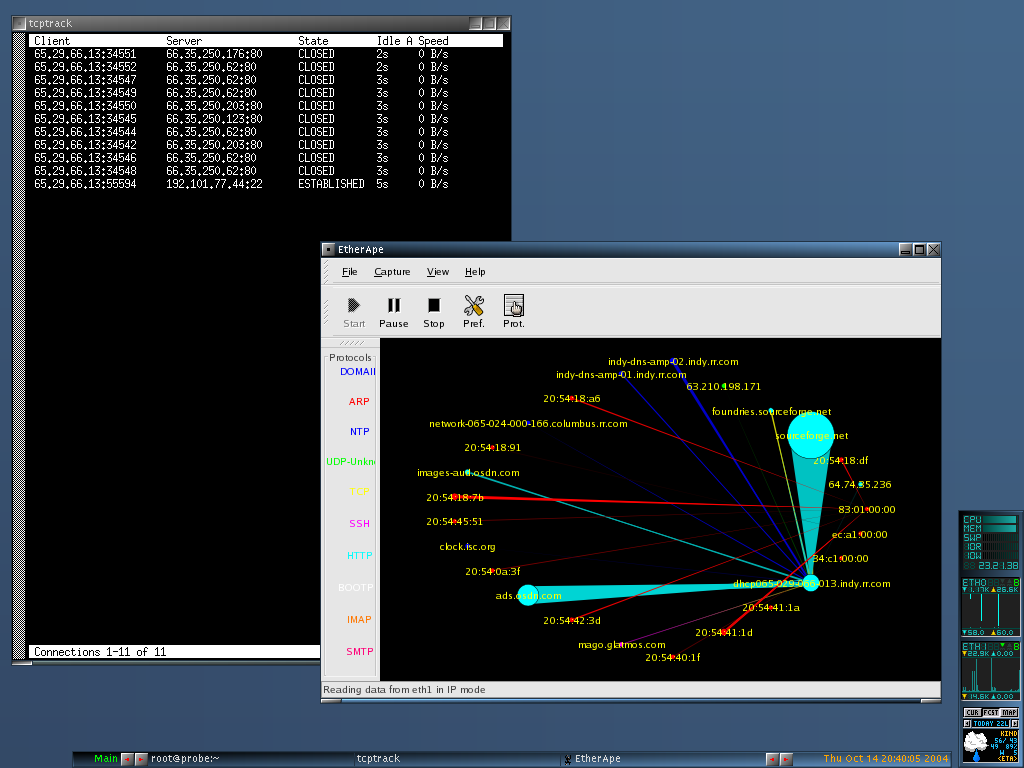
Network Monitor: Running TcpTrack and Etherape
This screen shows both
tcptrack and
etherape running on
NST. Both of these tools provide a glimpse of the current TCP connections/traffic.
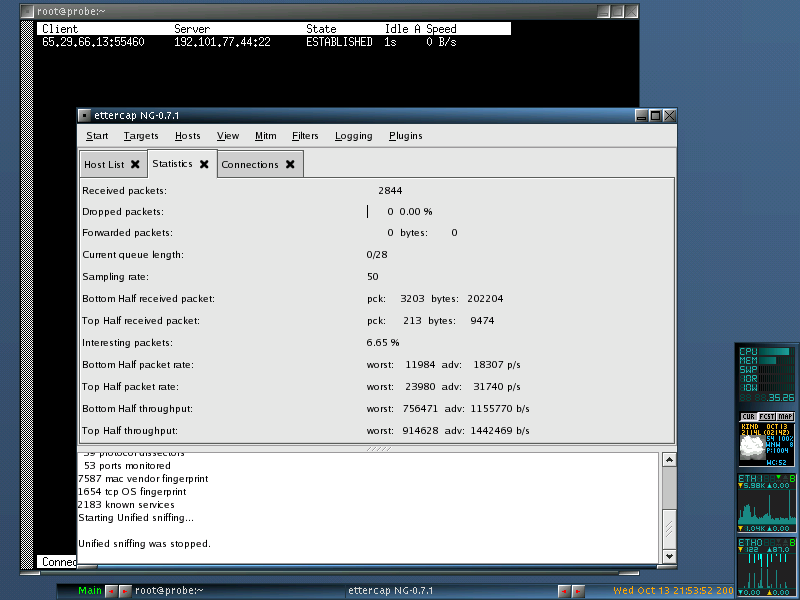
Network Sniffer: Running Ettercap
This screen shows information which
ettercap determined after a minute of sniffing the connection between my home LAN and the Internet.
Display: X Server
After seeing that
the @wmweather_Link() dock app indicated that it was raining in my
area, I decided to see if any lightning was occurring. While a real
time lightning display isn't included in the
NST distribution (its
not really intended for monitoring weather), I was able to make use of
the X server capabilities built into the
NST. I was able to run my
real time lightning display utility on a different system and use the
NST as the display. Looks like there's just rain in my area (the
midwest is pretty void of lightning). Ron Henderson and Paul
Blankenbaker share some history during the initial creation of the
National Lightning Detection Network. We were both involved in the
creation of a Lightning Direction Controller Finder
(
US
Patent 5,036,334).
System Monitor: DockApps
This screen shows various available DockApps on the NST
FluxBox menu.
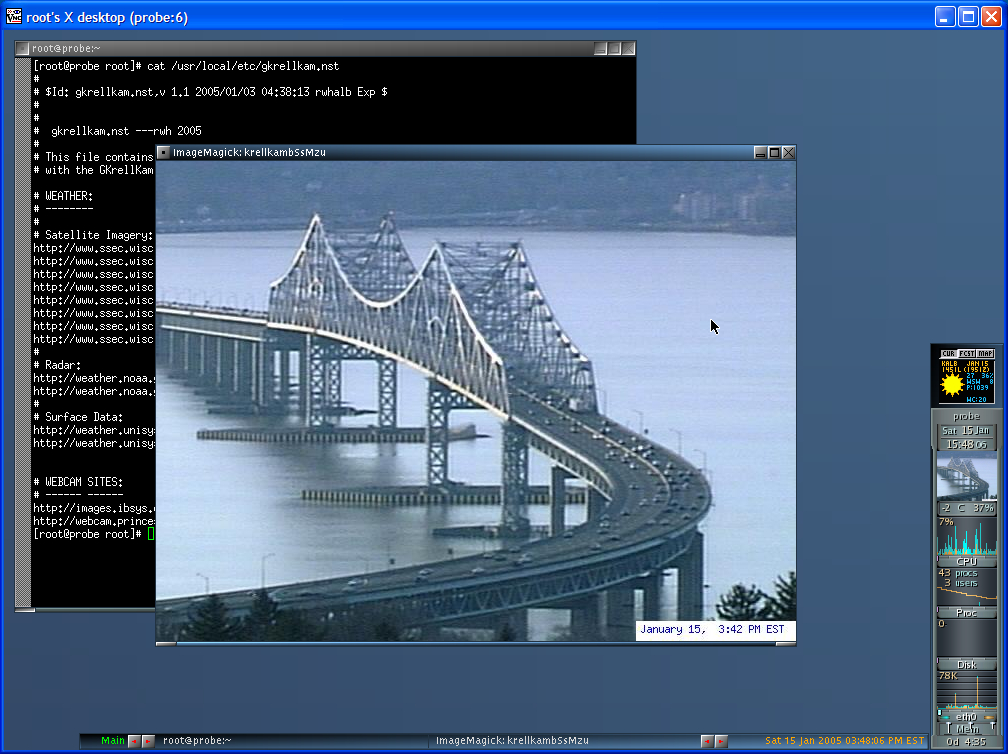
System Monitor/Physical Security: GKrellM and GKrellKam
This screen displays the
GKrellM application which is a single process stack of system monitors which supports themes to match its appearance to the associated window manager. The GKrellKam plugin is also shown. This plugin displays thumbnails of periodically updated images. A thumbnail and fully rendered image of the traffic flowing over the Tappanzee Bridge is displayed by the GKrellKam plugin.
Firewall Management: Firewall Builder
This screenshot shows the @fwbuilderLink("Firewall Builder") application running within the NST
FluxBox X Window manager. @fwbuilderLink("Firewall Builder") is a multi-platform firewall configuration and management tool that currently supports iptables, ipfilter, OpenBSD PF and Cisco PIX firewalls. The @fwbuilderLink("Firewall Builder") also supports management of the @iptablesLink() firewall ruleset policy within the
Linksys WRT54G and WRT54GS routers running firmware from
Sveasoft.
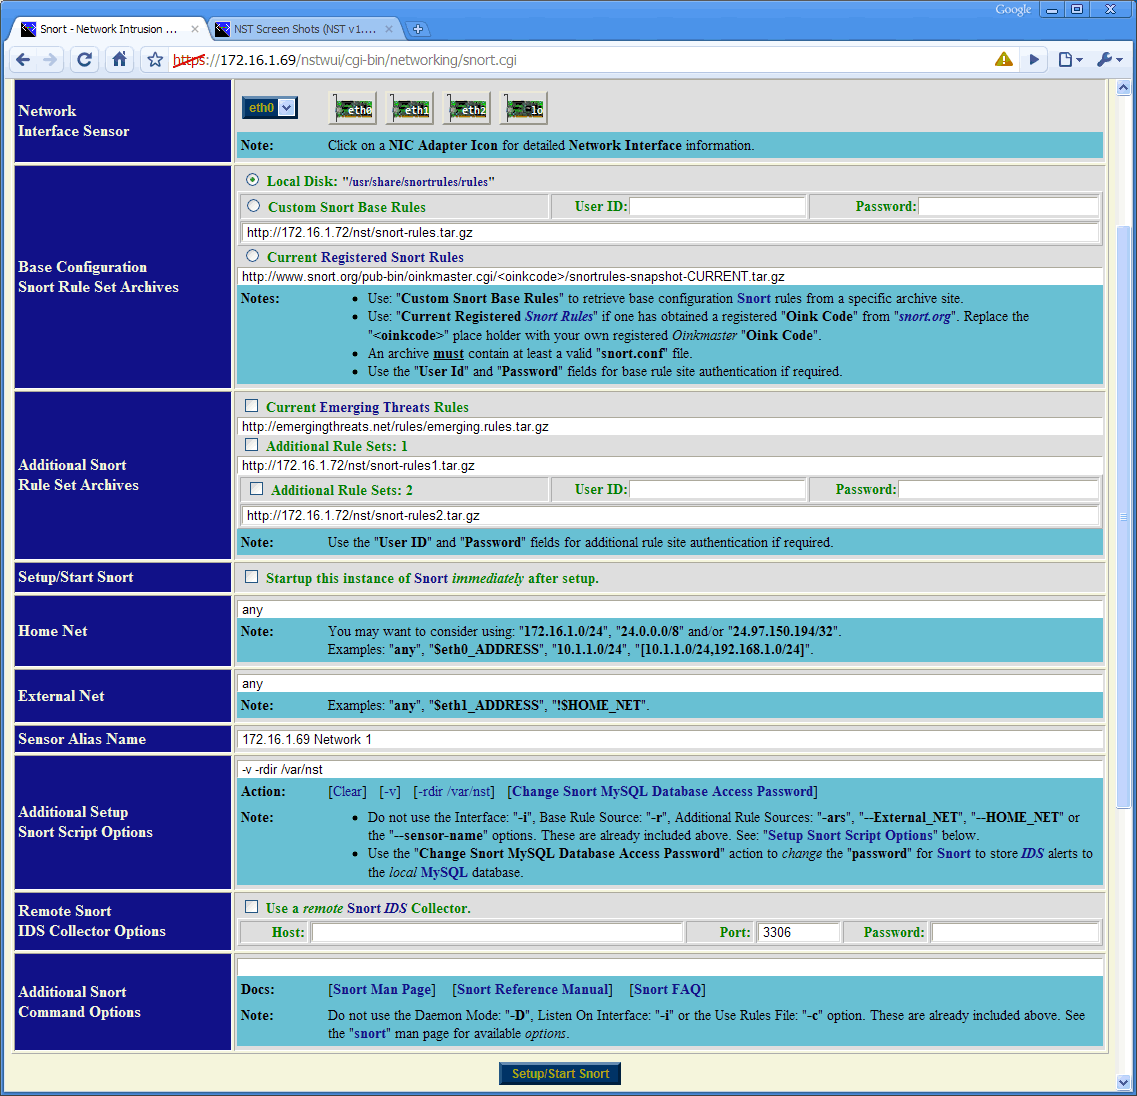
NST WUI: Snort Setup
This screen shows a portion of the
NST Web User Interface (
WUI) page for setting up the
snort IDS application.
NST WUI: File Viewer
This screen shows the
NST Web User Interface (
WUI) file viewer page. The
NST WUI file viewer is capable of viewing files in ASCII or hex mode, prepending line numbers, varying display widths and content output lengths, file editing, file download, file status and auto-refresh file tail viewing.